As a web design agency that consults with over 100 South African businesses every month, we see countless requests to add analytics. And for good reason.
Web analytics tools give businesses the ability to understand where your customers come from, what they need, and how they behave on your site. Businesses use these insights to focus on their best customer acquisition channels, identify which content holds attention, find the pages that convert best, and craft sharper marketing messages.
If that sounds overwhelming, don't worry. This article makes it dead simple. We'll cover the free tools that give you the most bang for your buck, what they measure, and how you can use them in your business right now to start getting more customers.
Let's jump in.
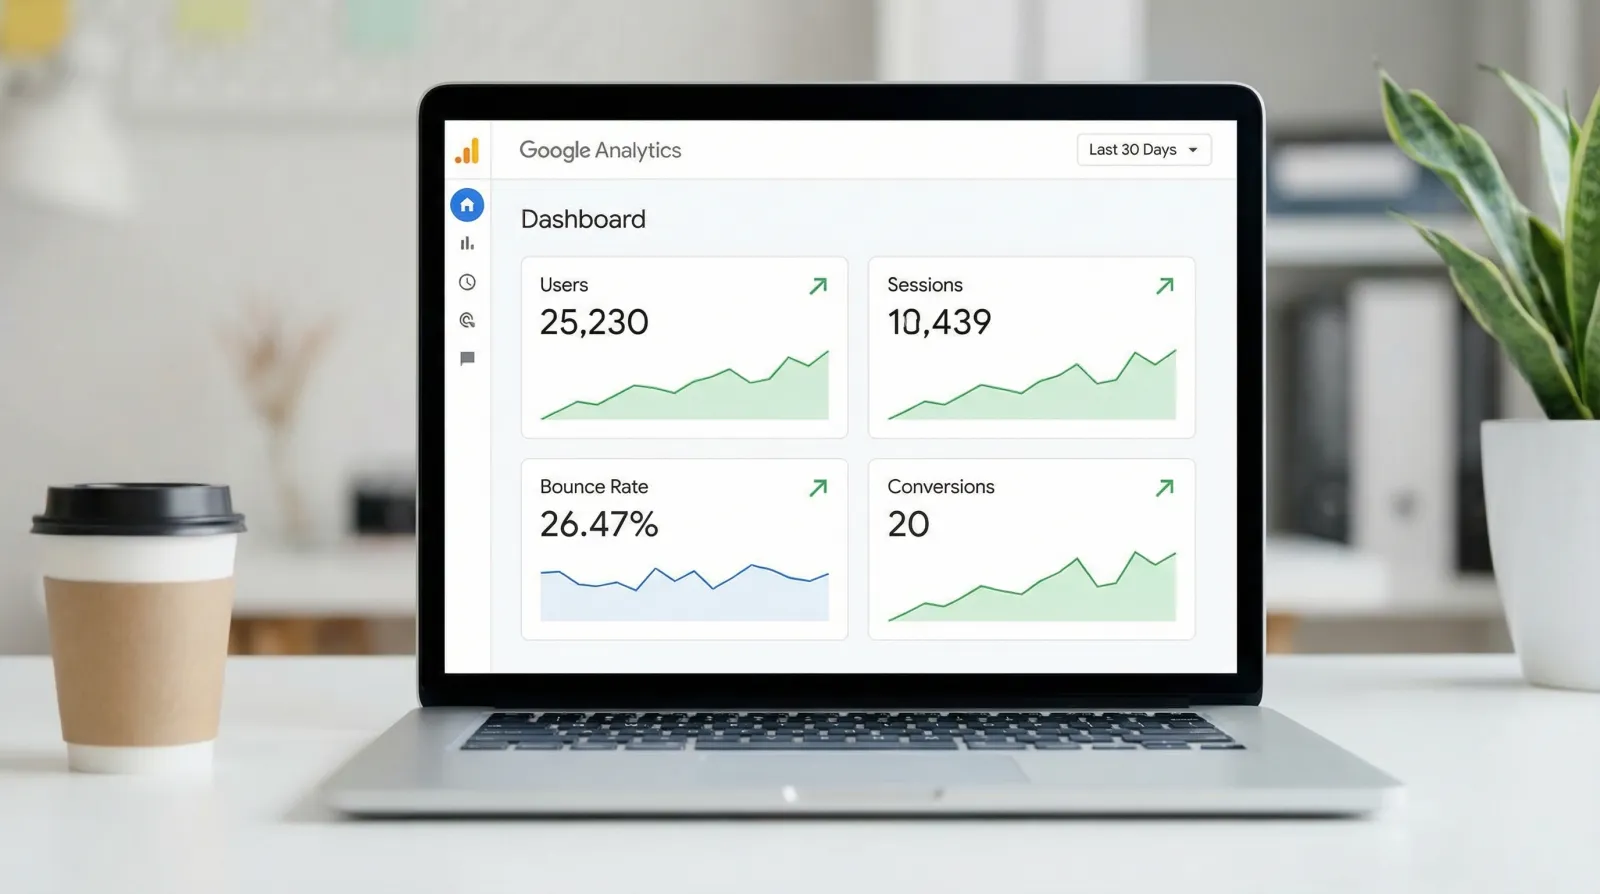
Google Analytics: Where Your Customers Come From and What Actions They Take
Google Analytics (GA4) is a free tool by Google. It tracks who visits your website, what they do there, and where they came from. It takes about 10 minutes to set up. You create an account, paste a small snippet of code onto your site, and you're in. Log into your dashboard anytime at analytics.google.com to see your reports.
Google Analytics offers a lot of reporting capabilities. That can be overwhelming, but fortunately you only need to track a few things to get most of the benefit. In our experience working with South African businesses, these are the most requested and highest impact metrics to track:
1. Conversion Events (Key Events)
What it is: You pick the action on your site that matters most. A form submission, a WhatsApp button tap, a phone call click, a purchase. Then you tell Google Analytics to count it every time someone does it. For most small SA businesses, that's the WhatsApp button that sends a message to the business's WhatsApp account where the real sales conversation starts.
Why you track it: Because without this number, you're guessing about the impact of any changes you make to your website or marketing. You change your headline, your layout, your offer. Did it work? You don't know. With conversion tracking, you do. More clicks this week than last week = the change worked. Fewer = change it back.
2. Traffic Source (Where Your Visitors Come From)
What it is: Every visitor got to your site somehow. Google search, Facebook, Instagram, LinkedIn, a WhatsApp link you shared, a paid ad. GA4 shows you exactly which channel sent each visitor.
Why you track it: Two reasons.
First, it saves you money. If you're spending R2,000/month boosting Facebook posts but barely anyone from Facebook converts, that's R2,000 you could spend better.
Second, it shows you where to focus. If LinkedIn is driving 80% of your actual sales conversations, that's your answer. Post more there, engage more there, double down on what's working. This helps businesses take the guesswork out of where they should be spending their marketing efforts.
3. Landing Page Performance (Which Pages Actually Convert)
What it is: This shows you which specific page a visitor lands on first, and whether that page turns them into a lead or a dead end. Not all pages are equal. Your homepage might get the most visits but your service page might convert three times better.
Why you track it: Instead of looking at your website as a whole, you look at the conversion rate of each landing page individually. If a specific service page has a high conversion rate, you know to drive more traffic directly to that page, not the homepage. If another page gets loads of traffic but nobody converts, that page needs work.
This is how you find your best-performing pages and send more people to them.
4. Geographic Location (Where Your Visitors Are)
What it is: GA4 shows you the city and region of every visitor. It does this automatically using IP addresses.
Why you track it: If you're a Cape Town business and half your ad spend is attracting clicks from Nairobi, you've got a leak. Flip side, if you're getting unexpected traffic from Durban, maybe there's demand there you didn't know about. Either way, you want to know where your actual audience is so your marketing rand goes further.
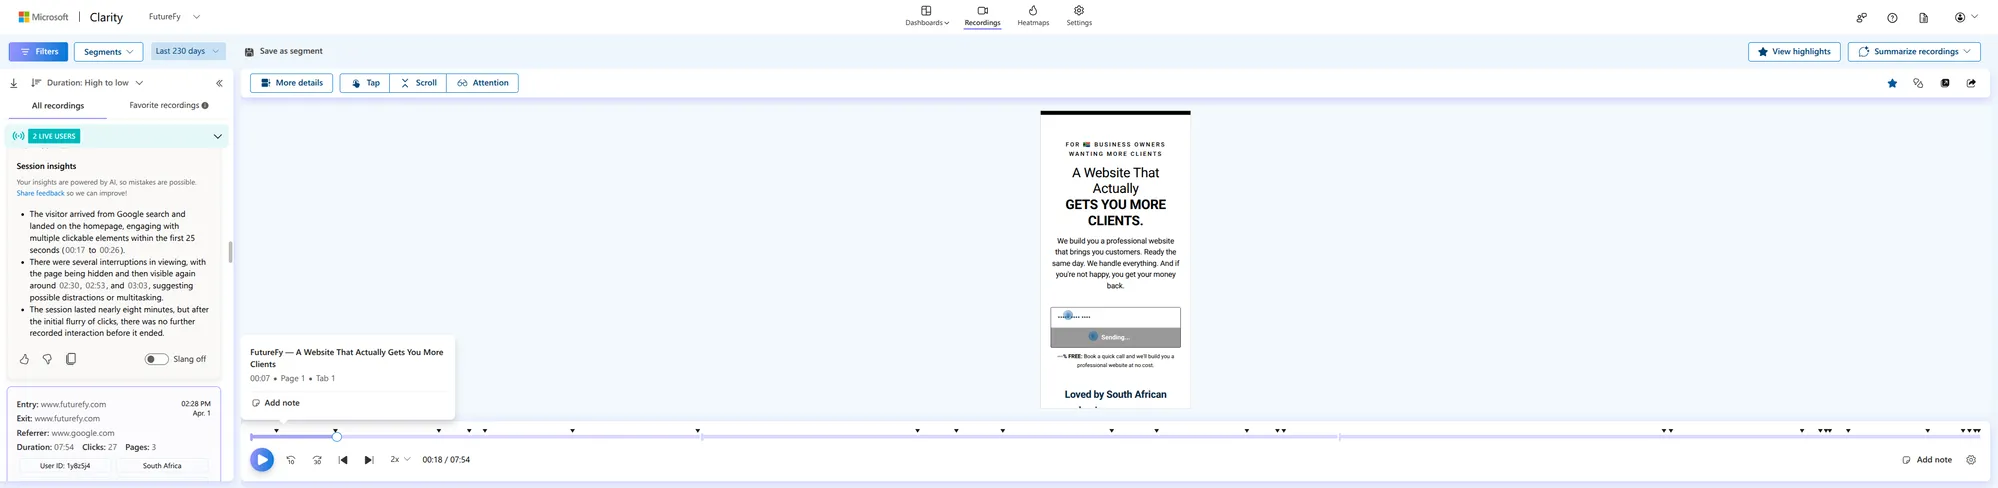
Microsoft Clarity: See Exactly What Visitors Do on Your Site
Microsoft Clarity is a free behavioural analytics tool by Microsoft. Where Google Analytics tells you the numbers (how many visitors, where they came from), Clarity shows you the behaviour. What people actually do on your pages. Where they click, how far they scroll, where they get stuck and leave. It's free with no traffic limits, and setup is the same idea. Create an account at clarity.microsoft.com, paste a small snippet of code onto your site, and you're in.
Clarity is packed with features, but for a small South African business just getting started, these four will give you the most value the fastest:
1. Session Recordings (Watch Real Visitors Use Your Site)
What it is: Clarity records anonymous videos of real people using your website. You can watch exactly how someone navigated your pages. Where they moved their mouse, what they clicked, where they paused, and where they gave up and left. It's like looking over a customer's shoulder as they navigate your site.
Why you track it: Because what you think users do on your site and what they actually do are almost never the same thing. You might assume everyone reads your services page top to bottom. The recording shows them scrolling past your pricing, tapping a button that doesn't work, and leaving. Five minutes of watching real sessions will teach you more about your site's problems than a month of guessing.
2. Heatmaps (Where People Click and How Far They Scroll)
What it is: Heatmaps show you a colour-coded overlay of your pages. Red and warm areas mean lots of clicks and attention. Blue and cold areas mean ignored. You get two types: click heatmaps (where people tap and click) and scroll heatmaps (how far down the page people actually get before they leave).
Why you track it: Because you might have your most important information (your pricing, your WhatsApp button, your call to action) sitting in a spot nobody ever sees. If your scroll heatmap shows 80% of visitors never make it past the first half of the page, and your contact button is at the bottom, that's your problem right there. Move it up, and watch what happens.
3. Rage Clicks (Where Visitors Get Frustrated)
What it is: Clarity automatically detects when a user clicks the same spot repeatedly in frustration. A button that looks clickable but isn't, a link that's broken, or a page that's loading too slowly. It flags these as "rage clicks" in your dashboard so you can find them instantly.
A frustrated visitor is a lost customer. If someone rage-clicks your "Get a Quote" button and nothing happens, they're not going to try a sixth time. They're going to your competitor. Clarity surfaces these frustration points automatically so you can fix the exact things that are costing you business.
4. Dead Clicks (Elements That Look Clickable But Aren't)
What it is: A dead click is when someone clicks on something (an image, a piece of text, a graphic) and nothing happens. They expected it to be a link or a button, but it wasn't. Clarity tracks every dead click across your site automatically.
Why you track it: Because dead clicks tell you what your visitors want to do that you're not letting them do. If 50 people this month clicked on a product image expecting it to enlarge or link somewhere, that's 50 people telling you "make this clickable." Dead clicks are basically free user research. Your visitors are showing you exactly what they expect from your site.
Tracking Pixels: Know What Happens After Someone Clicks Your Ad
If you run ads on Meta (Facebook/Instagram) or LinkedIn, each platform offers a small piece of tracking code, called a pixel or insight tag, that you install on your website. It works like a receipt system. When someone clicks your ad and lands on your site, the pixel tells the ad platform what that person did next. Did they fill in a form? Click your WhatsApp button? Buy something? Leave immediately?
Without a pixel installed, you're paying for ads blind. You can see how many people clicked, but you have no idea what happened after that. The pixel closes that gap.
Which one you need depends on your business:
Meta Pixel (Facebook & Instagram) — Best for B2C
What it is: A snippet of code from Meta that tracks what Facebook and Instagram users do on your website after clicking your ad, or even after just seeing it. You install it once, then tell it which actions matter (a purchase, an enquiry form, an "Add to Cart").
Why it matters for B2C: If you sell directly to consumers, whether that's an online store, a restaurant, a salon, or a rental business, your customers are scrolling Instagram and Facebook. The Meta Pixel does two things that will change how you spend your ad budget:
First, it tracks conversions. You stop measuring "clicks" and start measuring "how many people actually bought, enquired, or booked." That R500 you spent on a boosted post? Now you know if it brought in three paying customers worth R2,400 or zero.
Second, it builds retargeting audiences. Someone visited your product page but didn't buy? The pixel lets you show them a follow-up ad the next day. This is why you keep seeing ads for that thing you looked at once, and it works because these people already showed interest. For an SA e-commerce store or service business, retargeting is often where the best return on ad spend comes from.
LinkedIn Insight Tag — Best for B2B
What it is: LinkedIn's version of the same concept. A snippet of code that tracks what happens on your website when someone arrives from LinkedIn. Which pages they visit, whether they convert, and how long they stay.
Why it matters for B2B: If you sell to other businesses (consulting, software, professional services, agencies) your buyers are on LinkedIn, not Instagram. The Insight Tag gives you two things that matter for B2B:
First, conversion tracking for LinkedIn ads. If you're running Sponsored Content or InMail campaigns, you can see which campaigns actually generate leads versus which ones just generate clicks. B2B sales cycles are longer and lead costs are higher, so knowing that Campaign A produced 12 qualified leads while Campaign B produced 2 is the difference between scaling something that works and burning budget.
Second, audience demographics. The Insight Tag tells you the job titles, industries, and company sizes of people visiting your site, even if they came from Google, not LinkedIn. For a B2B business in South Africa, this is gold. You might discover that most of your website visitors are mid-level managers when you thought you were attracting C-suite decision makers. That changes your entire content and targeting strategy.
Which One Do You Need?
You don't need both. Pick the one that matches where your customers are:
Meta Pixel
You sell to consumers (food, fashion, fitness, beauty, events, e-commerce). Your customers are on Facebook and Instagram. Install the Meta Pixel to track conversions and build retargeting audiences.
LinkedIn Insight Tag
You sell to businesses (consulting, SaaS, professional services, recruitment). Your buyers are on LinkedIn. Install the Insight Tag to track campaign performance and see who's visiting your site.
If you sell to both, install both, but focus your energy on whichever channel drives more revenue. Track it, and the data will tell you.
Setup for both is the same idea. Create an ad account on the platform, generate your pixel/tag code, and paste it onto your site. If you use Google Tag Manager, you can install either one without touching your website code. Just add it as a new tag.
Start With One, Not All Four
You don't need to install everything today. If you do nothing else, install Google Analytics and set up one conversion event. That single step takes you from "I think my website is working" to "I know my website is working." That's the biggest jump you'll make.
Once you're comfortable with that, add Clarity so you can see why visitors aren't converting. Then, when you start running paid ads, install the right pixel so you can track what your ad spend actually produces.
Most South African businesses we work with go from zero analytics to meaningful insights within a week. Not because it's complicated, but because they kept putting it off thinking it was.
It's not. Start with one tool, set up one conversion event, and go from there.